

Using the Market Trend Page Template
A Veeva Compass account is required to use this feature.
The MyInsights Studio Market Trend page template displays the status of company and competitor products within a specified territory using prescription and medical claim data.
A MyInsights Studio Compass page template is available for customers to start with, helping users answer some of the most common sales questions:
- Are my products doing well in my territory?
- Which competitors are a threat in my territory?
- Which HCPs are performing well and should be maintained?
- Which HCPs do I need to take action on?
Who Can Use This Feature?
- Platforms – Browser, iPad, iPhone
- Licensing – Available to users with MyInsights and Compass
- Users – End Users
Enabling the Market Trend Page Template
- Ensure Viewing Compass Data Using MyInsights is configured.
-
Create or load your Analytic Product Groups based on the cohort definitions to define your market, the associated products, and the associated product-specific procedure codes you plan to visualize in the data.
MyInsights uses a combination of product names and product-specific procedure codes (for example, a J code specific to a branded product administration on a medical record). Enter the procedure code as the Analytics Product Group name, the procedure code description as the Analytics Product Group display name, and the associated product as the Analytics Product Group parent product group. You do not need to include the full procedure description in the display_name field on the analytics product group record.
- Download the Market Trend page template.
-
Log into MyInsights Studio to import and deploy the template to users.
Using the Market Trend Page Template to View Compass Data
Offline devices require an internet connection to display data.
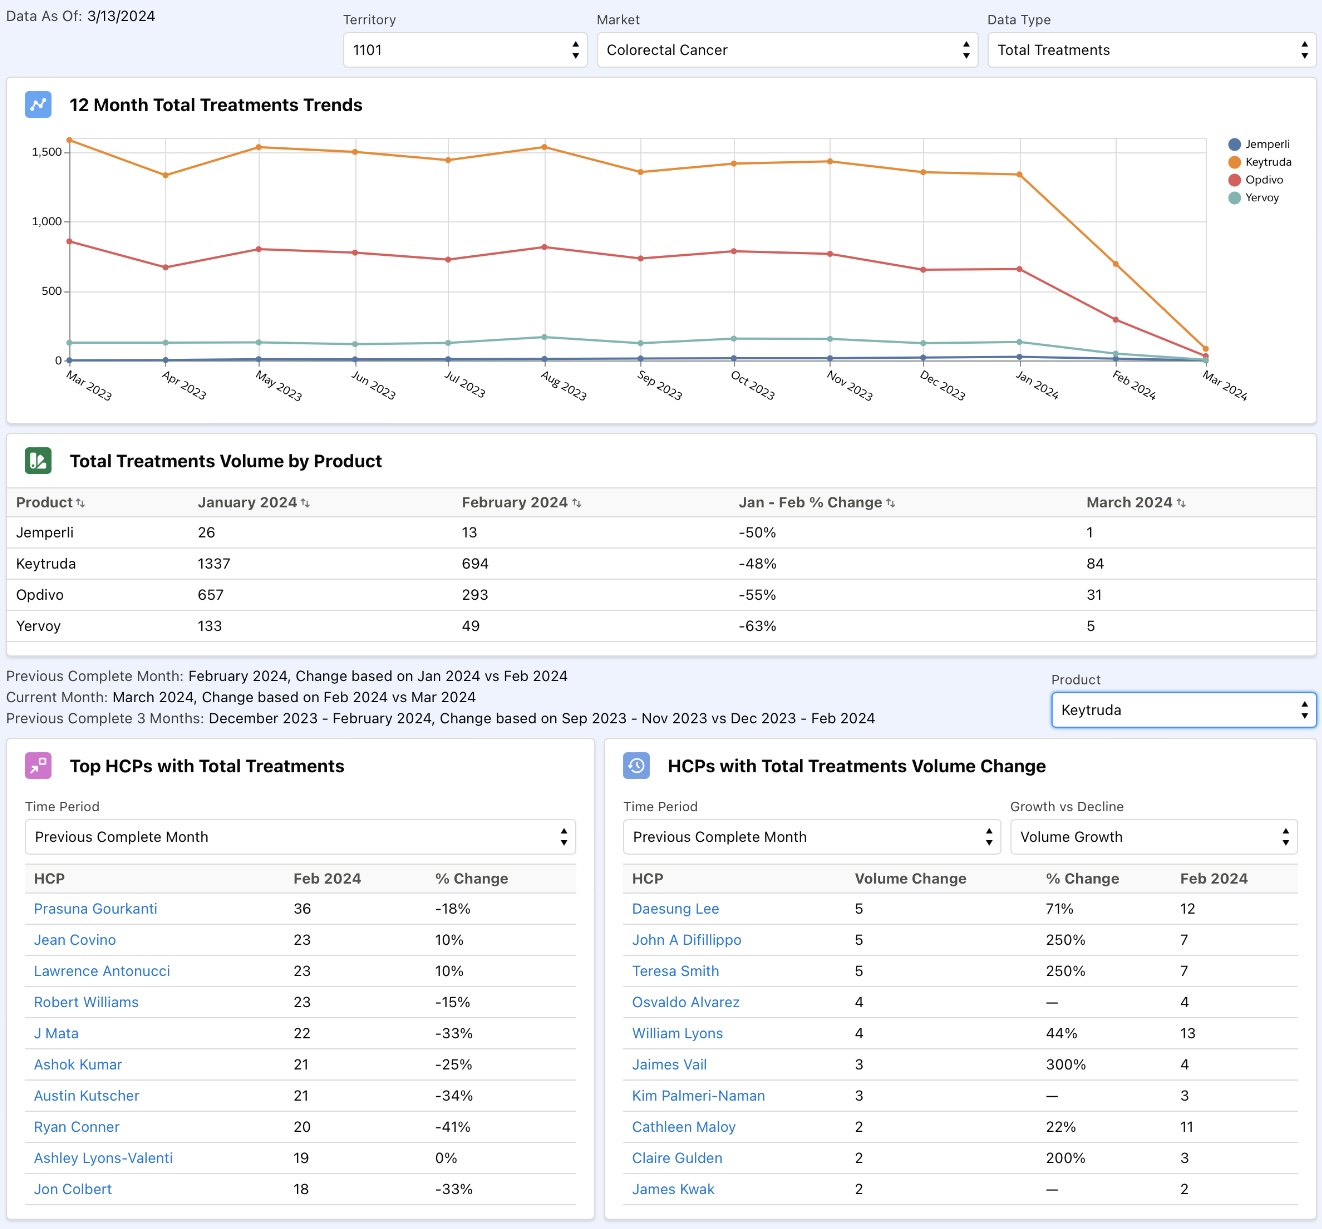
The Market Trend page template displays the following sections:
- Territory - Aligned territories for the user
- Market - Displays market list based on Analytics Market object
- Data Type - Select between:
- Total Treatments - Counted from Compass patient data
- New Patients - Counted from Compass patient data if a patient is taking any brand for the first time or after a one year period
- Treatment Trends - Displays twelve months’ total treatments or new patients trend by products in the selected market
- Treatment Volume by Product - Displays monthly total treatments or new patient growth for products in the selected market
- Product - Select from available products based on the Analytics Product Group object in the selected market to display top growth and top declining prescribers
- Top HCPs - Displays top ten growth HCPs for the selected product and time period
- HCP Volume Change - Displays top ten growth or declining HCPs for the selected product and time period
