

24R1.2 Functionality Guide
The Functionality Guide is intended for Sales Operations, Business Administrators, System Integrators, and others responsible for making decisions about what features are needed for end users to be successful and deciding which features work together with existing customer configurations.
Engage
Sending New Messages from the Chat Tab
HCPs can select the New Message button in the header of the Chat tab to start a chat thread or search for an existing chat thread. This allows HCPs with many connections and chat threads to quickly and easily send messages to the appropriate connection.
Selecting the New Message button displays the New Message modal. HCPs can:
- Select or search for an existing connection to navigate directly to that chat thread
- Enter an email address to invite an HCP or CRM user to connect
- Select Add My Contacts to invite an HCP or CRM user from their device’s address book contacts to connect. See Adding Address Book Contacts for more information.
Adding address book contacts is not supported on the Web platform.
MyInsights Studio
Using the Compass Prescriber Data Page Template (Available May 30, 2024)
A Veeva Compass account is required to use this feature.
Content creators can use the Compass Prescriber Data page template in MyInsights Studio to create a page embedding Compass prescriber data for projected prescriptions and procedures at the HCP level for retail and non-retail products. Field users can then use this information to understand market trends and identify HCPs they should contact.
The Prescriber Data page template is available for content creators to start with, and helps end users answer some of the most common sales questions:
- How many new prescriptions were written in the last week in my territory?
- Which prescription markets are trending up?
- Which HCPs prescribed the most?
Enabling the Prescriber Data Page Template
- Ensure Viewing Compass Data Using MyInsights is configured.
- Create or load your Analytic Product Groups, based on the cohort definitions, to define your market and the associated diagnosis code you plan to visualize in the data. Enter the diagnosis code to the Analytics Product Group name, and the diagnosis description to the Analytics Product Group display name. Map the Analytics Product Group to an Analytics Market.
Remove decimals from diagnosis codes when entering the code to the Analytics Product Group name. For example, C18.0 should be entered as C180.
- Download the Prescriber Data page template.
Using the Prescriber Data Page Template
Offline devices require an internet connection to display data.
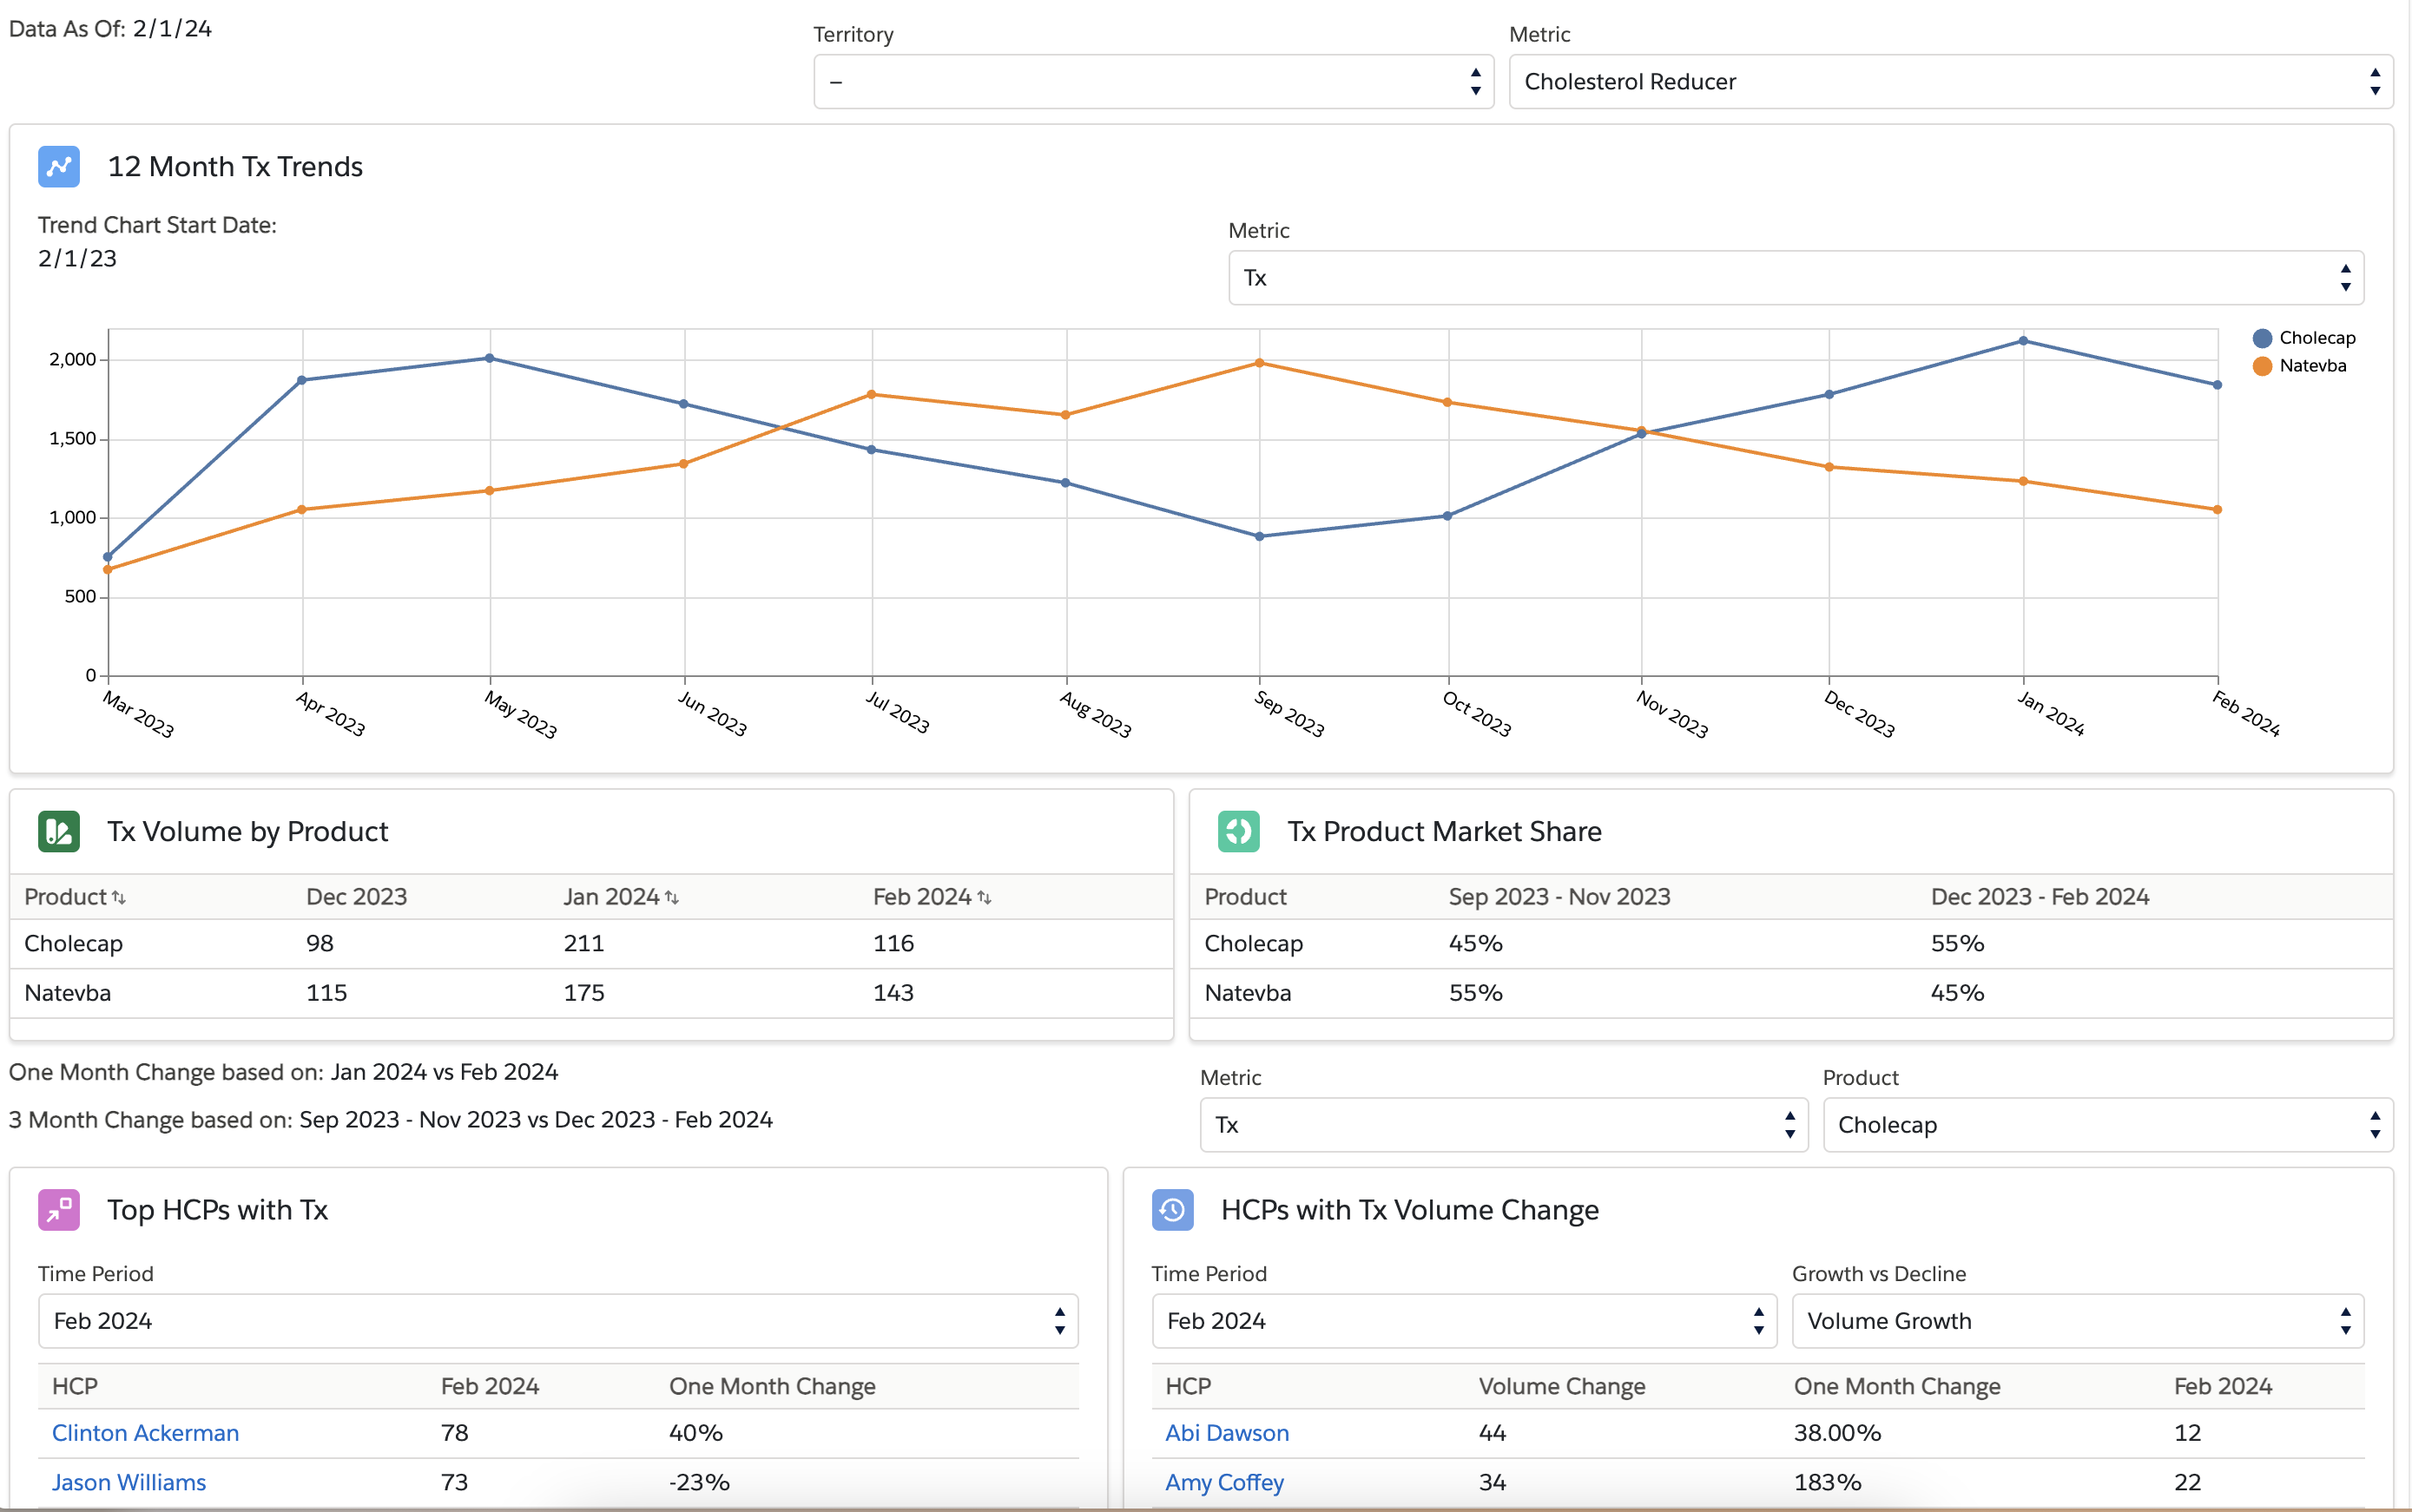
The Prescriber Data page template displays the following sections:
Content creators can extend the date range in the template to display up to 90 days of data.
- 12 Month Tx Trends - Displays trends from the last 12 months of data for the selected market and metric
- Tx Volume by Product - Displays the total prescription volume for the most recent three months of data
- Tx Product Market Share - Displays the market share information for the most recent six months of data
- Top HCPs with Tx - Displays the top or bottom HCPs sorted by the volume of the selected product and metric and in the selected time period
- HCPs with Tx Volume Change - DIsplays the top or bottom HCPs sorted by the volume change of the selected product and metric and in the selected time period
