Viewing Reports in the Analytics Tab
- Browser
The Fixed Reports Analytics tab contains the various report pages. At the top of the tab is a Report picklist containing the Fixed Reports pages the user can view. After selecting a report page, the Analytics tab refreshes to display the selected report.
The following report pages are available for viewing in the Analytics tab:
- Top Accounts
- Territory Comparison
- Territory Sales Analysis
- Average Calls Per Day
- Reach and Frequency
- Efforts vs. Results
- Territory Payer Analysis
- Cycle Plan Analysis
After signing in to Veeva CRM on a mobile device, users can select the VInsights tab to automatically sign in online and view Fixed Reports in the embedded browser.
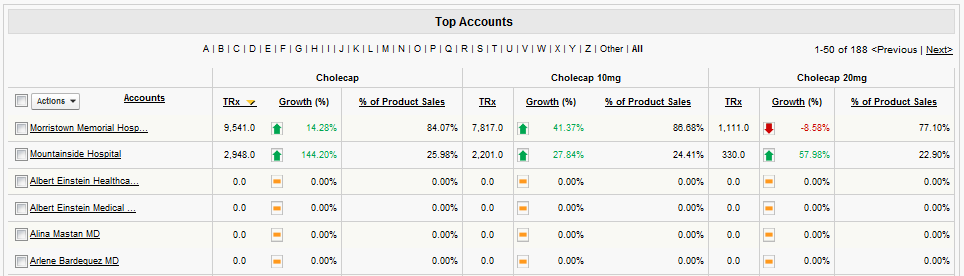
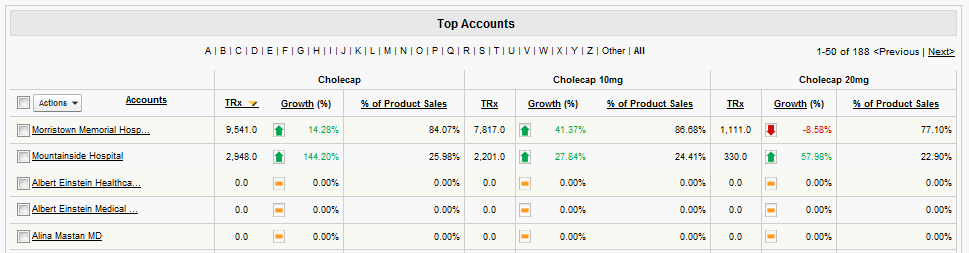
Top Accounts Report
The Top Accounts report on all Fixed Reports pages contains a Select All check box as well as an Actions button. When the Select All check box is selected, all the Top Accounts in the report are selected. When the Select All check box is deselected, any accounts that are currently selected are deselected (similar to My Accounts). This allows users to quickly select multiple accounts and perform actions from the Actions buttons to all the selected account at once, for example, scheduling calls or adding the selected accounts to an Account List.
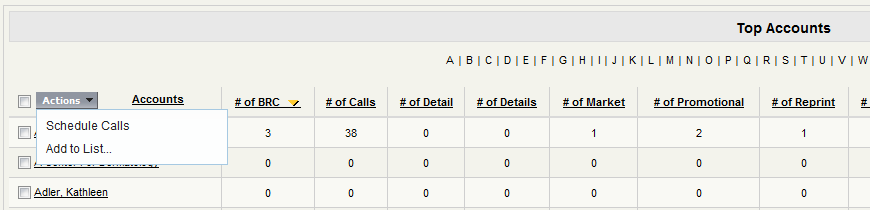
To further analyze account information, two metrics are available on the Top Accounts report:
- Account Market Share per Product (AcctMktShareProd) – percentage of the market’s total sales attributable to a specified product over a specified period of time for a given account = total sales for the given product for the Account divided by the Account’s Market Volume. The same metric is available on the Account Summary report.
- Account Market Volume (AcctMktVol) – total sales over a specified period of time for a given account
These metrics affect the following reports:
- Territory Sales Analysis
- Territory Comparison
The metrics can be displayed using the Top Accounts Configurable Columns. If the TOP_ACCTS_COLS_vod Veeva Setting is enabled with a value of TOP_ACCTS_COLS;;Analytics, customers can add, remove, or re-order the columns if AcctMktVol is placed inside a field grouping. See Managing Columns for Top Accounts Reports for more information.
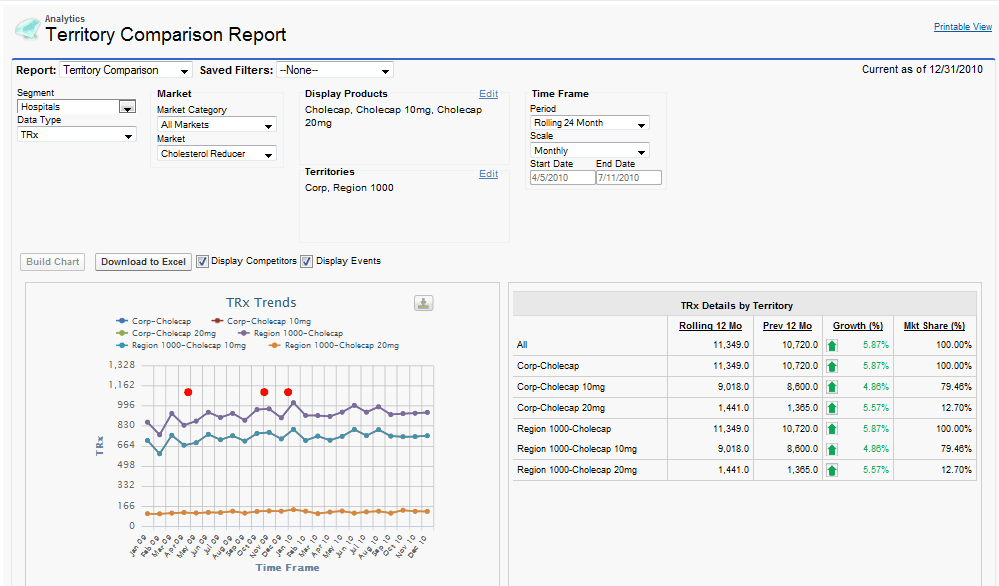
Territory Comparison Report
The Territory Comparison report provides users with the ability to compare aggregated sales data across multiple territories.
The Territory Comparison report contains the following reports:
|
Report Name |
Description |
|---|---|
|
Sales Trends |
The Sales Trend Report displays trending of the selected Metric for the selected Territories over the corresponding time frame. Displays data for products defined as Company Products. |
|
Sales Details |
Sales Details displays the sum of Sales Data for the currently selected time frame Sales Data by Territory. For each Territory, the sum of the previous time frame is calculated as well as the Growth between the two time periods and the corresponding Market Share for the current time frame. Displays data for products defined as Company Products. If the Period is Rolling 24 Months, then the current and previous 12 months display. |
|
Product Sales Trends |
The Sales Trend Report displays trending of the selected Metric for the selected Products for the Territories over the corresponding time frame. If the Period is Rolling 24 Months, then the current and previous 12 months display. |
|
Product Sales Details |
Sales Details displays the sum of Sales Data for the currently selected time frame Sales Data by Product for the Territories. For each product, the sum of the previous time frame is calculated as well as the Growth between the two time periods and the corresponding Market Share for the current time frame. |
|
Average Sales by Territory |
Displays the Average Sales by Territory for the Selected Time Frame. |
|
Growth by Territory |
Displays the Growth by Territory for the Selected Time Frame. |
|
Year-over-Year Growth by Territory |
Displays the Growth by Territory based upon a year-over-year comparison. |
|
Goal Details |
Displays a comparison of actual sales to sales goals. Also displays attainment of goals as a percentage of target. |
|
Account List |
Displays a list of Account as defined by the selected criteria with aggregated Product Sales Data. |
The Territory Comparison report contains the following controls:
|
Control Name |
Description |
|---|---|
|
Segment Picklist |
The Segment Picklist displays the My Accounts views that the User is assigned. The Segments control the data that is displayed for each of the reports by defining a subset of Accounts to display Sales Data. Additionally, the Segment picklist contains an “All” value – selecting this value will run the report against all accounts that are aligned to the selected territories. |
|
Market Category Picklist |
The Market Category Picklist allows the User to choose whether to see all Markets that the Account has Sales Data for or the Markets that the User is interested in based upon their My Setup products. |
|
Market Picklist |
The Market Picklist is defined based on the Markets available on the Analytics Product Group records. |
|
Data Type Picklist |
The Data Type picklist displays all of the different types of Sales Data (i.e. NRx, TRx, Units, etc.) available for the selected Account. If a Territory Adjusted Sales Data data type is selected, the data displayed will be based on the pre-allocated sales data loaded by account and territory. |
|
Period |
The Period controls the display of the time associated to each of the reports. The available values are as follows: Rolling 1 Month, Rolling 3 Month, Rolling 6 Month, Rolling 12 Month, Rolling 24 Month, YTD and Custom. If the Weekly time scale is selected, the Period picklist displays 4 Weeks and 13 Weeks instead of Rolling 1 Month and Rolling 3 Month. Sales data for the selected Time Frame is displayed for each of the report charts. The Time Frame options available are dynamically displayed based upon the Sales Data information. For example, if only 12 Months of Sales Data is loaded for a Sales File, then the Rolling 24 Months time frame option will not be available for selection. In addition, Quarterly buckets will only be displayed if all data contained in the aggregation is available. As an example, if a Quarterly bucket consisted of January through March, and only January and February data was loaded, then the January through March data point will not be displayed. |
|
Start Date & End Date |
If the user selects the Custom option in the Period picklist, the Start Date and End Date are enabled, allowing the user to select a custom time period for all reports on the page. If a user selects anything other than Custom, these controls are disabled and have no effect on the time frame of the report. |
|
Scale |
The Scale controls how the Sales Data will be displayed from a Time Frame perspective. The available values are: Weekly (if applicable), Monthly, and Quarterly. |
|
Territory Selector |
The Territory Selector allows a User to navigate up and down the Territory and to select the Territories for comparison. A User will only be able to select Territories that they are assigned to or those territories that exist below the assigned Territories. |
|
Compare To |
The Compare To control allows users to compare their performance and results against territories that are above them in the territory hierarchy |
|
Display Competitors Checkbox |
The Display Competitors checkbox determines if non-Company Analytics Product Group Records will be displayed on the Reports. The default for this checkbox is checked. |
|
Display Events Checkbox |
The Display Events Checkbox determines if the Product Events are displayed on the Sales Trend and Mkt Share Trends Reports. The default behavior for this checkbox is checked. |
|
Display Goals Checkbox |
When checked and if Sales Goals were pre-loaded, Fixed Reports will display Sales Goals information alongside historical sales. |
|
Build Chart Button |
The Build Chart Button will reload the Account Summary Reports based on the currently selected filter criteria. If any of the filter criteria has been changed, a red asterisk will be displayed next to the Build Chart button. |
|
Download to Excel Button |
The Download to Excel button exports the underlying data for each of the Reports to Microsoft Excel. |
The territories available for selection and comparison are based upon a user’s assignment in the Territory Hierarchy. Users can select any territory they are assigned to and all territories below each assigned territory.
Additionally, if the Zip to Terr object is populated, the Territory to Zip Code alignment is available for selection at the lowest level Territory nodes. You must load zip level sales data to see data using the zip code selection.
In the Sales Details by Territory reports, each sub-territory's market share is its percentage of the parent territory's sales.
Growth is calculated as: (current period sales - previous period sales) / previous period sales = Growth %
Average Sales per Product is calculated as: Total sales per product in the selected time frame for a specific territory / # periods in selected time frame = Average Sales per Product
In the Top Accounts report, the market share is each account's share of the overall segment, as selected in the report options.
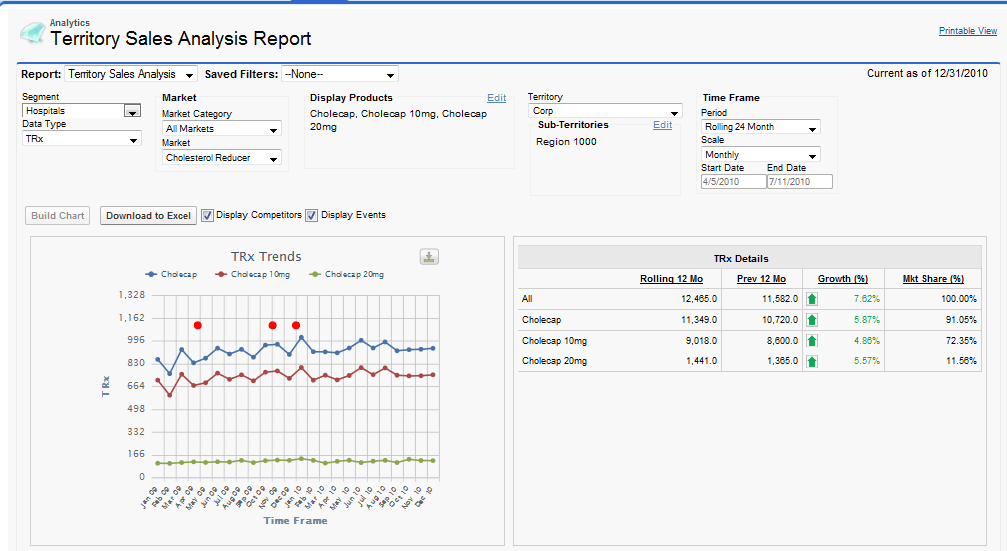
Territory Sales Analysis Report
The Territory Sales Analysis report allows users to perform analysis on aggregated sales data for a specific territory. Users can analyze a specific territory and the performance of different products within that territory. This provides a deeper level of insight for a territory than the Territory Comparison Report.
The Territory Sales Analysis report contains the following reports:
|
Report Name |
Description |
|---|---|
|
Sales Trends |
The Sales Trend Report displays trending of the selected Metric for the selected Products for the selected Territory over the corresponding time frame. |
|
Sales Details |
Sales Details displays the sum of Sales Data for the currently selected time frame Sales Data by Product for the selected Territory. For each Product, the sum of the previous time frame is calculated as well as the Growth between the two time periods and the corresponding Market Share for the current time frame. If the Period is Rolling 24 Months, then the current and previous 12 months display. |
|
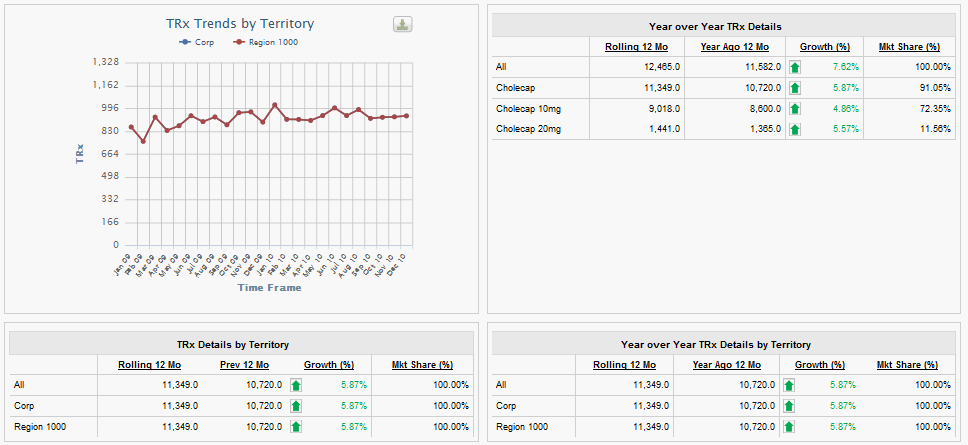
Sales Trends by Territory |
The Sales Trend Report displays trending of the selected Metric for the underlying Territories over the corresponding time frame. The Territories/Zip Codes displayed are defined by the next lower level of Territories or Zip Codes based on the selected Territory. This report ignores the Display Product filter. |
|
Sales Details by Territory |
Sales Details displays the sum of Sales Data for the currently selected time frame Sales Data by the underlying Territories. For each Territory, the sum of the previous time frame is calculated as well as the Growth between the two time periods and the corresponding Market Share for the current time frame. The Territories/Zip Codes displayed are defined by the next lower level of Territories or Zip Codes based on the selected Territory. This report ignores the Display Product filter. |
|
Average Sales by Territory |
Displays the Average Sales by Territory for the Selected Time Frame. The Territories/Zip Codes displayed are defined by the next lower level of Territories or Zip Codes based on the selected Territory. This report ignores the Display Product filter. |
|
Growth by Territory |
Displays the Growth by Territory for the Selected Time Frame. The Territories/Zip Codes displayed are defined by the next lower level of Territories or Zip Codes based on the selected Territory. This report ignores the Display Product filter. |
|
Year-over-Year Growth by Territory |
Displays the Growth by Territory based upon a year-over-year comparison. The Territories/Zip Codes displayed are defined by the next lower level of Territories or Zip Codes based on the selected Territory. This report ignores the Display Product filter. |
|
Goal Details |
Displays a comparison of actual sales to sales goals. Also displays attainment of goals as a percentage of target. |
|
Account List |
Displays a list of Accounts as defined by the selected criteria with aggregated Product Sales Data. |
The Territory Sales Analysis report contains the following controls:
|
Control Name |
Description |
|---|---|
|
Segment Picklist |
The Segment Picklist displays the My Accounts views that the User is assigned. The Segments control the data that is displayed for each of the reports by defining a subset of Accounts to display Sales Data. Additionally, the Segment picklist contains an “All” value – selecting this value will run the report against all accounts that are aligned to the selected territories. |
|
Market Category Picklist |
The Market Category Picklist allows the User to choose whether to see all Markets that the Account has Sales Data for or the Markets that the User is interested in based upon their My Setup products. |
|
Market Picklist |
The Market Picklist is defined based on the Markets available on the Analytics Product Group records. |
|
Data Type Picklist |
The Data Type picklist displays all of the different types of Sales Data (i.e. NRx, TRx, Units, etc.) available for the selected Account. If a Territory Adjusted Sales Data data type is selected, the data displayed will be based on the pre-allocated sales data loaded by account and territory. |
|
Period |
The Period controls the display of the time associated to each of the reports. The available values are as follows: Rolling 1 Month, Rolling 3 Month, Rolling 6 Month, Rolling 12 Month, Rolling 24 Month, YTD and Custom. If the Weekly time scale is selected, the Period picklist displays 4 Weeks and 13 Weeks instead of Rolling 1 Month and Rolling 3 Month. Sales data for the selected Time Frame is displayed for each of the report charts. The Time Frame options available are dynamically displayed based upon the Sales Data information. For example, if only 12 Months of Sales Data is loaded for a Sales File, then the Rolling 24 Months time frame option will not be available for selection. In addition, Quarterly buckets will only be displayed if all data contained in the aggregation is available. As an example, if a Quarterly bucket consisted of January through March, and only January and February data was loaded, then the January through March data point will not be displayed. |
|
Start Date & End Date |
If the user selects the Custom option in the Period picklist, the Start Date and End Date are enabled, allowing the user to select a custom time period for all reports on the page. If a user selects anything other than Custom, these controls are disabled and have no effect on the time frame of the report. |
|
Scale |
The Scale controls how the Sales Data will be displayed from a Time Frame perspective. The available values are: Weekly (if applicable), Monthly, and Quarterly. |
|
Territory Picklist |
The Territory Picklist allows a User to select a Territory for Analysis. A User will only be able to select Territories that they are assigned to or those territories that exist below the assigned Territories. |
|
Compare To Selector |
The Compare To control allows users to compare their performance and results against territories that are above them in the territory hierarchy. |
|
Display Competitors Checkbox |
The Display Competitors checkbox determines if non-Company Analytics Product Group Records will be displayed on the Reports. The default for this checkbox is checked. |
|
Display Events Checkbox |
The Display Events Checkbox determines if the Product Events are displayed on the Sales Trend and Market Share Trends Reports. The default behavior for this checkbox is checked. |
|
Display Goals Checkbox |
When checked and if Sales Goals were pre-loaded, Fixed Reports will display Sales Goals information alongside historical sales. |
|
Build Chart Button |
The Build Chart Button will reload the Account Summary Reports based on the currently selected filter criteria. If any of the filter criteria has been changed, a red asterisk will be displayed next to the Build Chart button. |
|
Download to Excel Button |
The Download to Excel button exports the underlying data for each of the Reports to Microsoft Excel. |
The territories available for selection and comparison are based upon a user’s assignment in the Territory Hierarchy. Users can select any territory they are assigned to and all territories below each assigned territory.
In the Sales Details by Territory reports, each sub-territory's market share is its percentage of the parent territory's sales.
Growth is calculated as: (current period sales - previous period sales) / previous period sales = Growth %
Average Sales per Product is calculated as: Total sales per product in the selected time frame for a specific territory / # periods in selected time frame = Average Sales per Product
In the Top Accounts report, the market share is each account's share of the overall segment, as selected in the report options.
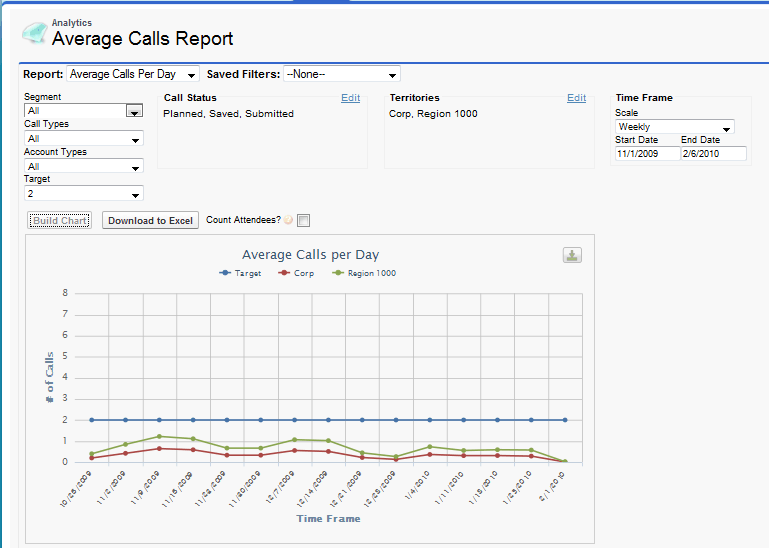
Average Calls Per Day Report
The Average Calls Per Day report is based on the following:
- WORK_HOURS Veeva Setting, with a default value of 8
- Five day work week
- Includes time off territory (TOT) records in the calculation
Calls entered in the territory and its children are divided by the total number of working days in the territory and its children. If a territory is unassigned, the number of calls and number of hours is zero, so the calculation of average calls per day is not affected.
Average calls per day is calculated as:
- # of users assigned to selected territory and sub-territories x WORK_HOURS x # of weekdays in selected time frame = # Available Hours
- # of available hours - total TOT for selected territory and sub-territories = Total # Hours Worked
- total # of hours worked / 8 (hours per workday) = # Days Worked
- # of calls made in selected territory and sub-territories / # of days worked = Average Calls per Day
Because time off territory records are based on eight hour workdays, Fixed Reports automatically adjusts the hours based on the WORK_HOURS setting when it calculates the Total TOT Hours. For example, if WORK_HOURS is set to 9 (hours per workday), then Fixed Reports adjusts Total TOT hours based on a nine hour work day.
All entered TOT records are included in the Average Calls Per Day report, regardless of the record's approval status.
The Average Calls Per Day report contains the following controls:
|
Control Name |
Description |
|---|---|
|
Segment Picklist |
The Segment Picklist displays the My Accounts views that the User is assigned. The Segments control the data that is displayed for each of the reports by defining a subset of Accounts to display Call Data. Additionally, the Segment picklist contains an “All” value – selecting this value will run the report against all calls that were stamped with one of the territories selected in the Territory Picklist. |
|
Call Types Picklist |
The Call Type Picklist allows users to select specific Call Types to define the data that is displayed in the chart. |
|
Account Type Picklist |
The Account Type Picklist allows users to select specific Account Types to define the data that is displayed in the chart. |
|
Target Picklist |
The Target Picklist allows a user to select a Target value to be displayed on the report. The Target value is displayed as a horizontal line across the chart. |
|
Time Frame |
The Time Frame controls the display of the time associated to the report. |
|
Territory Selector |
The Territory Selector allows a User to navigate up and down the Territory and to select the Territories for comparison. A User will only be able to select Territories that they are assigned to or those territories that exist below the assigned Territories. |
|
Build Chart Button |
The Build Chart Button will reload the Account Summary Reports based on the currently selected filter criteria. If any of the filter criteria has been changed, a red asterisk will be displayed next to the Build Chart button. |
|
Download to Excel Button |
The Download to Excel button exports the underlying data for each of the Reports to Microsoft Excel. |
|
Export to Image |
The Export to Image button exports the Average Calls per Day report as an image. This image can be embedded within various documents. |
|
Count Attendees? |
When checked, each person attending a group call will be counted as an individual call. When unchecked, group calls will be counted as a single call. |
| Call Status | The Call Status Picklist allows users to select specific Call Statuses to define the data displayed in the chart. |
When the scale of the report is monthly or quarterly, the Start and End dates are adjusted to fill the entire month. The averages are calculated based on the dates for the quarter or month, not by day.
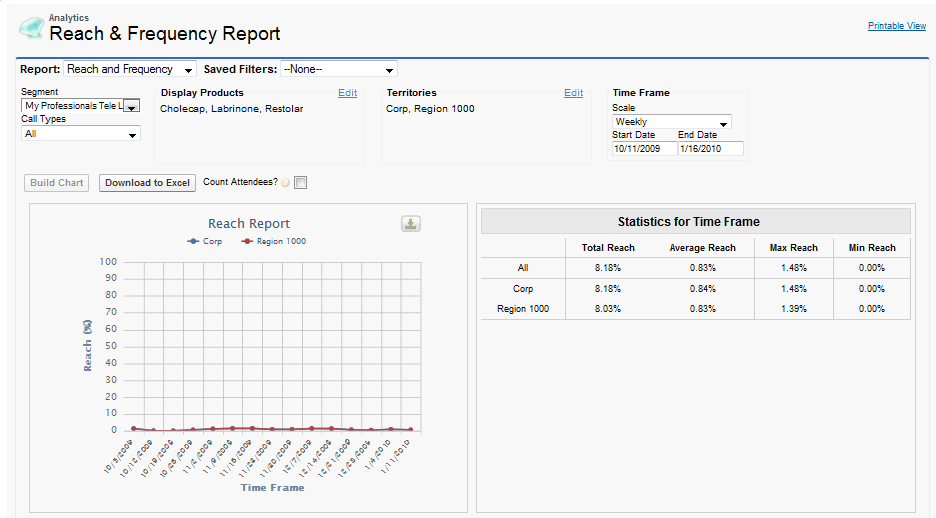
Reach and Frequency Report
The Reach and Frequency report allows users to determine if they are reaching or contacting their accounts, as well as letting users identify how often they are meeting with their accounts. Reach is the percent of accounts with a call over a specific time period. Frequency is the number of calls divided by the time period.
The Reach and Frequency report is based on all accounts within a territory and the calls made by that territory. The report aggregates data to the district, regional, and national levels as well.
Saved and Submitted calls are counted. Planned Calls are also counted if their scheduled date is in the future and within the selected timeframe.
Call Counts for Detail Products
The Reach and Frequency report captures Call counts for detail products associated with detail groups. Users can select a product in the Display Products filter to display all matching Calls.
A full refresh is triggered automatically every fourteen days. A full refresh occurs if the last successful activity sync occurred more than thirteen days ago.
To force a refresh:
- Navigate to the Veeva Analytics Processes tab.
- Delete the processes listed in the Veeva Analytics Process Name column. This triggers the system to check that there is no last sync date recorded for any previously run processes.
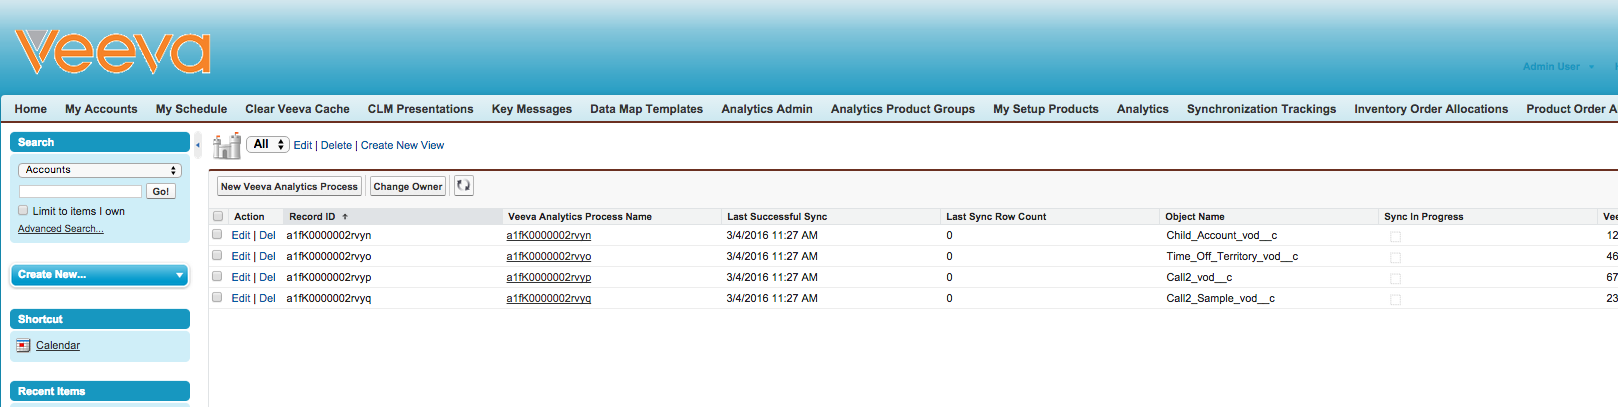
To force a refresh for the Call2_vod object, delete the corresponding process.
If the Veeva Analytics Processes tab is not available, perform the following steps to create it:
- Navigate to Setup > User Interface > Tabs (Setup > Create > Tabs in Classic).
- Select New.
- Select Veeva Analytics Processes from the Object drop-down list.
- Select a Tab Style.
- Select the profile visibility option.
- Select Next.
- Select the appropriate apps.
- Select Save.
The Reach and Frequency report contains the following reports:
|
Report Name |
Description |
|---|---|
|
Reach Trend |
The Reach Trend report shows the number of key accounts reached over a period of time at the territory level. |
|
Frequency Trend |
The Frequency Trend report shows the frequency that key accounts have been called on over a period of time at the territory level. |
|
Statistics for Time Frame (Reach Details) |
The Statistics for Time Frame report shows the percentages of accounts reached over a specific period of time based on the time frame selected. This report shows total percentage reached, average percentage reached, maximum percentage reacted, and minimum percentage reached. |
|
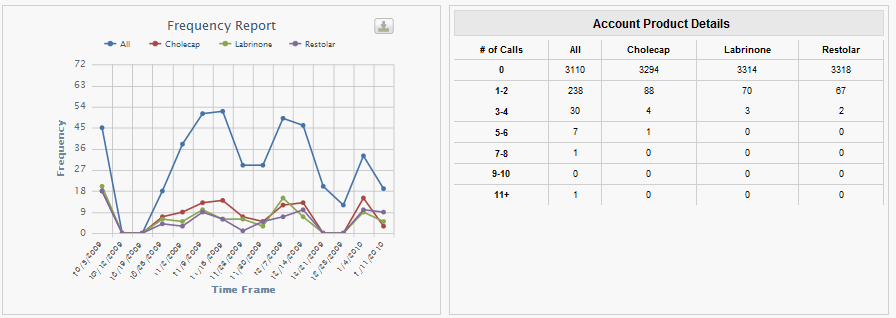
Account Product Details (Frequency Details) |
The Account Product Details report displays the number of accounts that have been called on and the number of times the accounts have been called on based on a range, such as no calls, 1-2 calls, 3-4 calls, etc. This is displayed on an overall basis, as well as by product. |
|
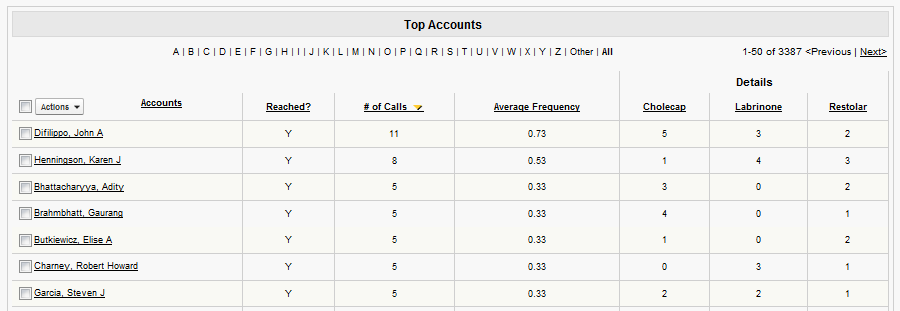
Reach and Frequency Top Accounts |
The Reach and Frequency Top Accounts report displays the top accounts based on the # of times they were called. Users can also see whether or not the account was reached, the average frequency for the selected time frame and detail visits by product. The user can sort according to any of the columns, and can filter accounts using the rolodex located at the top or bottom of the table. |
The Reach and Frequency report contains the following controls:
|
Control Name |
Description |
|---|---|
|
Segment Picklist |
The Segment Picklist displays the My Accounts views that the User is assigned. The Segments control the data that is displayed for each of the reports by defining a subset of Accounts to display Call Data. Additionally, the Segment picklist contains an “All” value – selecting this value will run the report against all calls that were stamped with one of the territories selected in the Territory Picklist. |
|
Call Types Picklist |
The Call Types picklist allows the user to select the type of calls that they would like to see on the report. Some examples would include: Call Only, Detail Only, etc. |
|
Display Products |
The Display Products list lets the user select the products they would like to see used in the report. The report will display the calls that have had these products detailed in them when the report is run. |
|
Start Date & End Date |
The Start Date and End Date allow the user to select the time period that they want to see their reach and frequency for. |
|
Scale |
The Scale controls how the call data will be displayed from a time frame perspective. The available values are: Weekly (if applicable), Monthly, and Quarterly. |
|
Territory Picklist |
The Territory Picklist allows a User to select a Territory for Analysis. A User will only be able to select Territories that they are assigned to or those territories that exist below the assigned Territories. |
|
Build Chart Button |
The Build Chart Button will reload the Reach and Frequency Reports based on the currently selected filter criteria. If any of the filter criteria has been changed, a red asterisk will be displayed next to the Build Chart button. |
|
Download to Excel Button |
The Download to Excel button exports the underlying data for each of the Reports to Microsoft Excel. |
|
Count Attendees? |
When checked, each person attending a group call will be counted as an individual call. When unchecked, group calls will be counted as a single call. |
| Call Status | Users can filter Call Count results by Call Status. This allows users to view and analyze selected Calls and to distinguish between different Call statuses when generating the report. |
For the Statistics for Time Frame report, the reach calculations are:
- Reach % = # accounts in segment that have been called on / # accounts in segment
- Total Reach % = # accounts that have been called on within the time frame / total # accounts
- Average Reach % = Sum of Reach % for all points in the time frame / # points in time frame
- Min (Max) Reach % = Min (Max) Reach % across the time frame
For the Reach and Frequency Top Accounts report, the Average Frequency is calculated as:
- # calls against the account / (# days in the selected time frame / # days in each unit) = Average Frequency, where unit is based on the scale picklist, Weekly = 7 days, Monthly = 30 days, Quarterly = 90 days)
Reach Trend and Reach Details Reports
Frequency Trend and Frequency Details Reports
Reach and Frequency Top Accounts Report
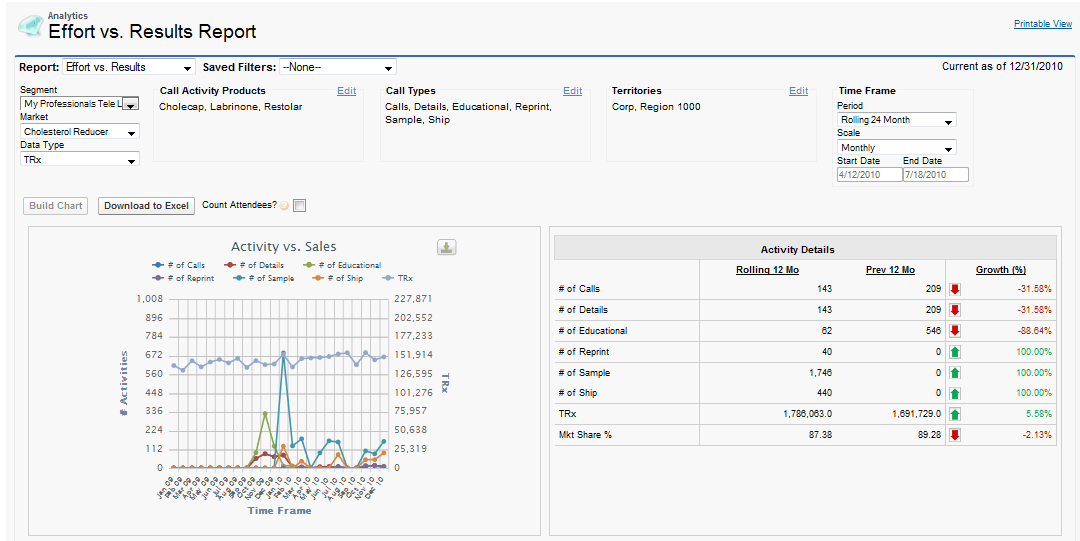
Efforts vs Results Report
The Efforts vs. Results report provides a way for users to review the number of calls they make compared to the impact they have on sales. The effort contains the number of calls, details, samples, and promotional items for a user. The results are based on the sales data loaded into CRM. Sales data for Efforts vs. Results can be either at the account level or at the pre-aggregated territory level.
Saved and Submitted calls are counted. Only calls occurring up to the data date of the sales data files are counted.
The Efforts vs. Results report contains the following reports:
|
Report Name |
Description |
|---|---|
|
Activity by Territory |
The Activity by Territory report displays the number of calls, details, samples, and promotional items at a territory level. The sales per territory are shown as well, which allows users to see growth at the territory level. |
|
Activity vs. Sales |
The Activity vs. Sales report is a trend report display the activity (calls, details, samples, and promotional items) versus the number of sales in the territory over a period of time. This is based off of the Time Frame controls. |
|
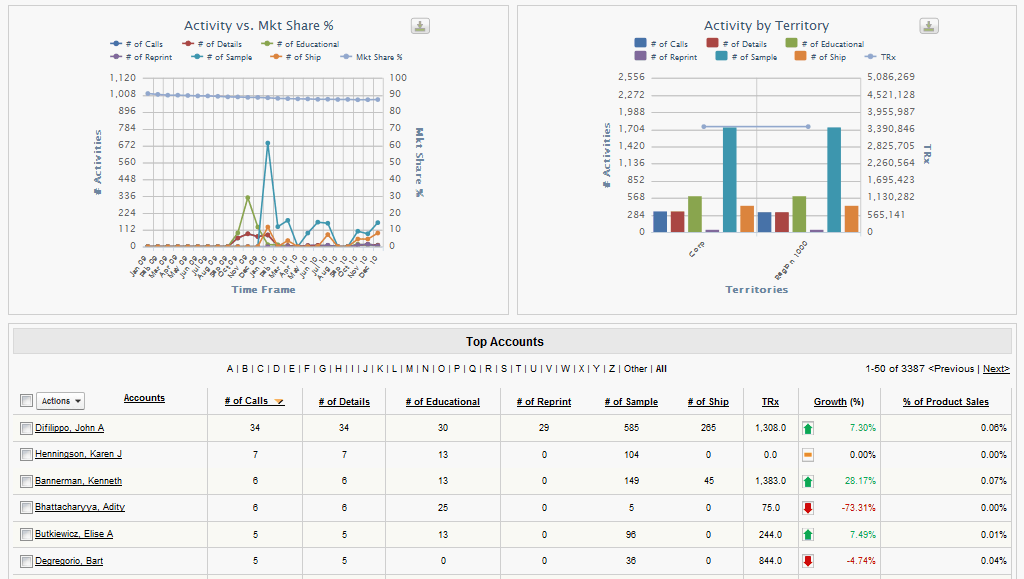
Activity vs. Market Share |
The Activity vs. Market Share report is a trend report that displays the activity (calls, details, samples, and promotional items) on a given territory as well as the market share percentage that the territory has. The time period is based on the Time Frame controls. |
|
Activity Details |
The Activity Details report shows the activity on a specific territory for the current timeframe versus the previous timeframe. The Activity Details report also shows the growth that has occurred from the previous timeframe. If the Period is Rolling 24 Months, then the current and previous 12 months display. |
|
Effort vs. Results Top Accounts |
The Effort vs. Results Top Accounts report displays the top accounts based on their percentage of growth. Users can also see the number of calls, details, samples, and promotional items for that account. The sales and market share percentage are shown on the report as well. The user can sort according to any of the columns, and can filter accounts using the rolodex located at the top or bottom of the table. |
The Efforts vs. Results report contains the following controls:
|
Control Name |
Description |
|---|---|
|
Segment Picklist |
The Segment Picklist displays the My Accounts views that the User is assigned. The Segments control the data that is displayed for each of the reports by defining a subset of Accounts to display Sales Data. Additionally, the Segment picklist contains an “All” value – selecting this value will run the report against all accounts that are aligned to the selected territories. |
|
Call Types Picklist |
The Call Types picklist allows the user to select the product type they would like to see on the report. Some examples would include: Call Only, Detail Only, etc. |
|
Market Picklist |
The Market Picklist values are defined based on the Markets available on the Analytics Product Group records. The Markets control the sales data that is displayed as well as the "# of Details" calculation. |
|
Data Type Picklist |
The Data Type picklist displays all of the different types of Sales Data (i.e. NRx, TRx, Units, etc.) that have been loaded into the application. If a Territory Adjusted Sales Data data type is selected, the data displayed will be based on the pre-allocated sales data loaded by account and territory. |
|
Scale Picklist |
The Scale controls how the call data will be displayed from a time frame perspective. The available values are: Weekly (if applicable), Monthly, and Quarterly. |
|
Period Picklist |
The Period controls the display of the time associated to each of the reports. The available values are as follows: Rolling 1 Month, Rolling 3 Month, Rolling 6 Month, Rolling 12 Month, Rolling 24 Month, YTD and Custom. . If the Weekly time scale is selected, the Period picklist displays 4 Weeks and 13 Weeks instead of Rolling 1 Month and Rolling 3 Month. Sales data for the selected Time Frame is displayed for each of the report charts. The Time Frame options available are dynamically displayed based upon the Sales Data information. For example, if only 12 Months of Sales Data is loaded for a Sales File, then the Rolling 24 Months time frame option will not be available for selection. In addition, Quarterly buckets will only be displayed if all data contained in the aggregation is available. As an example, if a Quarterly bucket consisted of January through March, and only January and February data was loaded, then the January through March data point will not be displayed. |
|
Start Date & End Date |
If the user selects the Custom option in the Period picklist, the Start Date and End Date are enabled, allowing the user to select a custom time period for all reports on the page. If a user selects anything other than Custom, these controls are disabled and have no effect on the time frame of the report. |
|
Territory Picklist |
The Territory Picklist allows a User to select a Territory for Analysis. A User will only be able to select Territories that they are assigned to or those territories that exist below the assigned territories. |
|
Build Chart Button |
The Build Chart Button will reload the Efforts vs. Results Reports based on the currently selected filter criteria. If any of the filter criteria has been changed, a red asterisk will be displayed next to the Build Chart button. |
|
Download to Excel Button |
The Download to Excel button exports the underlying data for each of the Reports to Microsoft Excel. |
|
Count Attendees? |
When checked, each person attending a group call will be counted as an individual call. When unchecked, group calls will be counted as a single call. |
|
Display Goals Checkbox |
When checked and if Sales Goals were pre-loaded, Fixed Reports will display Sales Goals information alongside historical sales. |
|
Call Status |
Users can filter Call Count results by Call Status. This allows users to view and analyze selected Calls and to distinguish between different Call statuses when generating the report. |
Market Share % for the Activity vs Market Share % report is calculated as: Company product sales in the selected market / All product sales in the selected market = Market Share %
The Effort vs Results Top Accounts report displays the raw calculations of the types of activities included in the analysis.
Efforts vs. Results Act vs. Sales and Act Details Reports
Efforts vs. Results Act vs. Mkt Share, Act by Territory and Top Accounts Reports
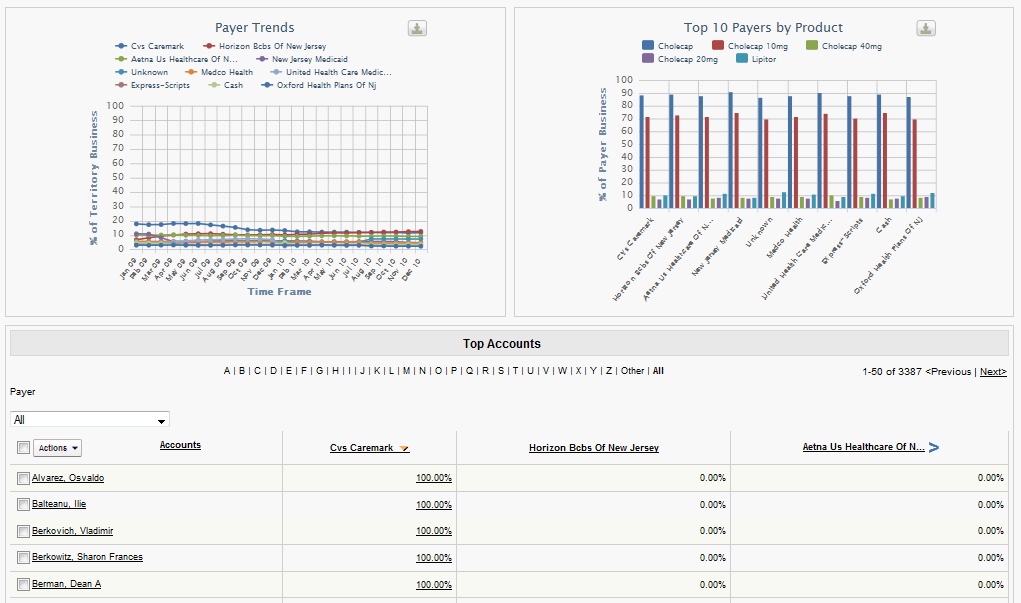
Territory Payer Analysis Report
The Territory Payer Analysis report enables users to identify key payer market drivers across their territory and for selected segments of HCPs. Users can analyze formulary details for each payer, payer sales trends, top payers by product and top accounts for each plan. They can also view a breakdown by product for each payer, which allows them to see details on which payers are supporting which products. These multiple reports of payer activity can give both reps and managers a high-level and a granular view of which payers are driving business within the selected territories.
Users will need access to the Territory Payer Analysis report for the report to display on the users’ Report drop down on the Analytics tab. Similar to the Prescriber Level Formulary, in order to display products in this report, the Do_Not_Display_in_Formulary_for_Rep_vod field on Analytics_Product_Group_vod must remain unselected.
The reports on this page do not support displaying the parent product group and its children simultaneously, so either the parent or the children must have Do_Not_Display_in_Formulary_for_Rep_vod selected.
The Territory Payer Analysis report contains the following reports:
|
Report Name |
Description |
|---|---|
|
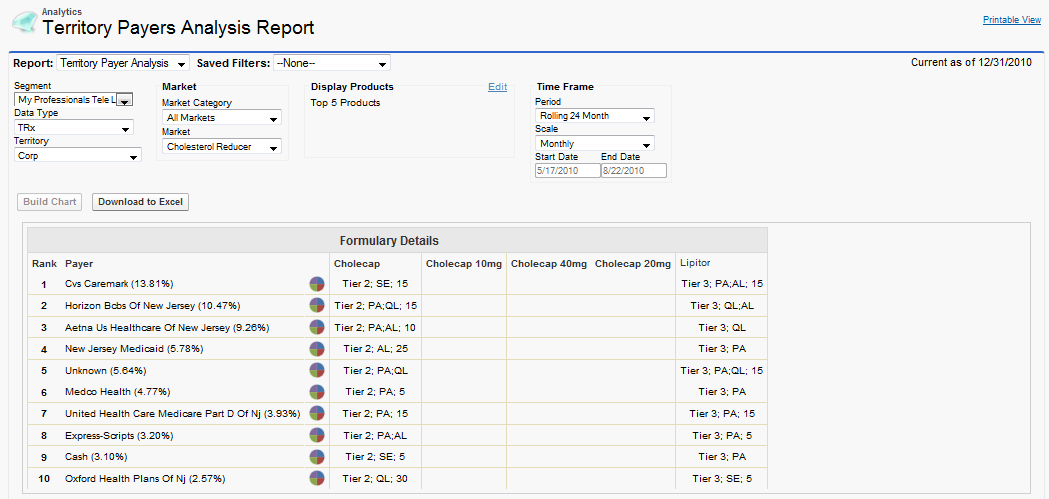
Formulary Details |
The Formulary Details report displays the territory’s top payers rank, name, % of sales and tiers and/or restrictions for each product-payer combination. A pie chart pop-up for each payer gives a breakdown by product. |
|
Top Payer by Product |
The Top Payer by Product report will display the % of each payer’s business by product, for each of the top 10 payers in the territory. The Payer names displayed on the report are driven off the values in the Payer_Plan_vod field in the Sales Data File. |
|
Payer Trends |
The Payer Trends report displays the percentage of business within the territory for each payer across a selected time frame. The time period is based on the Time Frame controls. |
|
Top Accounts by Payer |
The Territory Payer Analysis Top Accounts report displays the top accounts based on their percentage of business for each payer. Each percentage figure displayed is also a link which opens a dialog window which displays a breakdown by product, for the Account and Payer. |
The Territory Payer Analysis report contains the following controls:
|
Control Name |
Description |
|---|---|
|
Segment Picklist |
The Segment Picklist displays the My Accounts views that the User is assigned. The Segments control the data that is displayed for each of the reports by defining a subset of Accounts to display Sales Data. Additionally, the Segment picklist contains an “All” value – selecting this value will run the report against all accounts that are aligned to the selected territories. |
|
Market Category Picklist |
The Market Category Picklist allows the User to choose whether to see all Markets that the Account has Sales Data for or the Markets that the User is interested in based upon their My Setup products. |
|
Display Products Picklist |
The Display Products list lets the user select the products that they would like to see used in the report. The report will display the calls that have had these products detailed in them when the report is run. |
|
Market Picklist |
The Market Picklist is defined based on the Markets available on the Analytics Product Group records. |
|
Data Type Picklist |
The Data Type picklist displays all of the different types of Sales Data (i.e. NRx, TRx, Units, etc.) that have been loaded into the application. |
|
Scale Picklist |
The Scale controls how the call data will be displayed from a time frame perspective. The available values are: Weekly (if applicable), Monthly, and Quarterly. |
|
Period Picklist |
The Period controls the display of the time associated to each of the reports. The available values are based on the scale of the data. If the Weekly time scale is selected, the Period picklist displays 4 Weeks and 13 Weeks instead of Rolling 1 Month and Rolling 3 Month. Sales data for the selected Time Frame is displayed for each of the report charts. The Time Frame options available are dynamically displayed based upon the Sales Data information. For example, if only 12 Months of Sales Data is loaded for a Sales File, then the Rolling 24 Months time frame option will not be available for selection. In addition, Quarterly buckets will only be displayed if all data contained in the aggregation is available. As an example, if a Quarterly bucket consisted of January through March, and only January and February data was loaded, then the January through March data point will not be displayed. |
|
Start Date & End Date |
If the user selects the Custom option in the Period picklist, the Start Date and End Date are enabled, allowing the user to select a custom time period for all reports on the page. If a user selects anything other than Custom, these controls are disabled and have no effect on the time frame of the report. |
|
Territory Picklist |
The Territory Picklist allows a User to select a Territory for Analysis. A User will only be able to select Territories that they are assigned to or those territories that exist below the assigned territories. |
|
Build Chart Button |
The Build Chart Button will reload the Efforts vs. Results Reports based on the currently selected filter criteria. If any of the filter criteria has been changed, a red asterisk will be displayed next to the Build Chart button. |
|
Download to Excel Button |
The Download to Excel button exports the underlying data for each of the Reports to Microsoft Excel. |
The Formulary Details report displays the top 10 payers in the territory, ordered by percent of business represented by the payer. This is calculated as: Sales across all products reimbursed by the payer / Sales across all products in the selected territories = % business represented by the payer
The values in the Top Accounts represent the % business for each account through each payer and is calculated as: Account Sales through Payer / Total Sales for the Account = % business for the account through payer
Territory Payer Analysis Formulary Details
Territory Payer Analysis Payer Trends, Top 10 Payers and Top Accounts
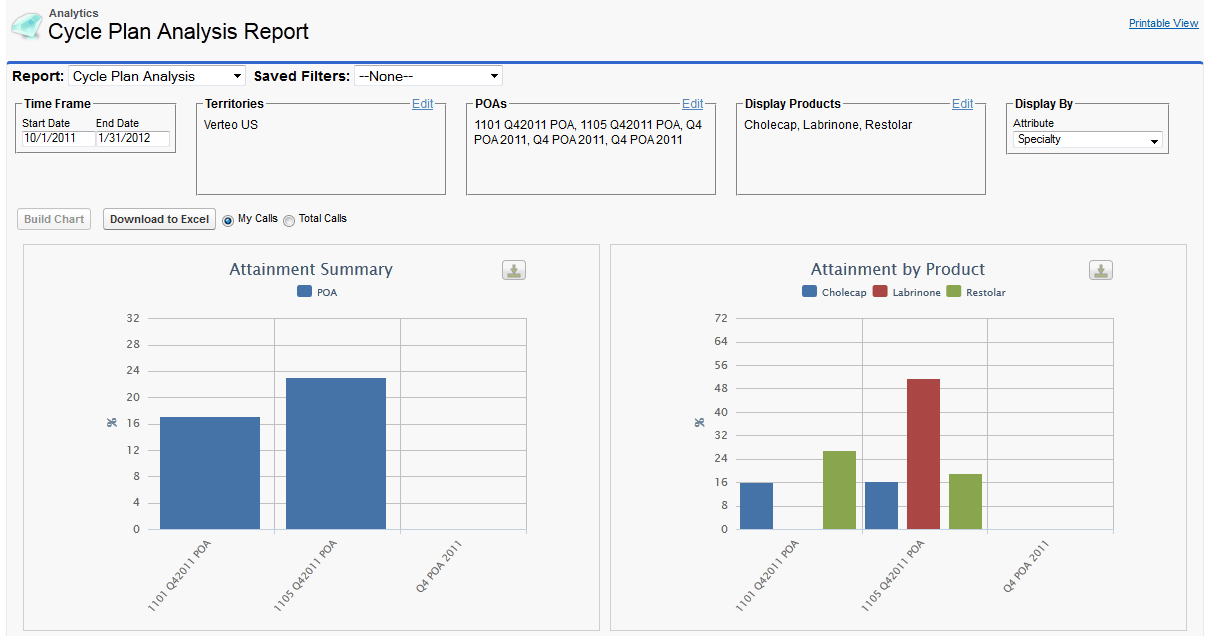
Cycle Plan Analysis Report
The Cycle Plan Analysis report allows users and managers to analyze their cycle plan information in a dedicated dashboard. A number of built-in reports are provided, for example, overall call attainment, attainment by detailed product, and attainment by cycle plan.
To view this report, ensure Cycle Plans are configured.
The Cycle Plan Analysis report contains the following reports:
|
Report Name |
Description |
|---|---|
|
Attainment Summary |
Call attainment percentage for the selected cycle plans |
|
Attainment by Product |
Product detail attainment for each selected cycle plan |
|
Attainment by Cycle Plan |
Attainment for each Cycle Plan, by selected product |
|
Frequency Details |
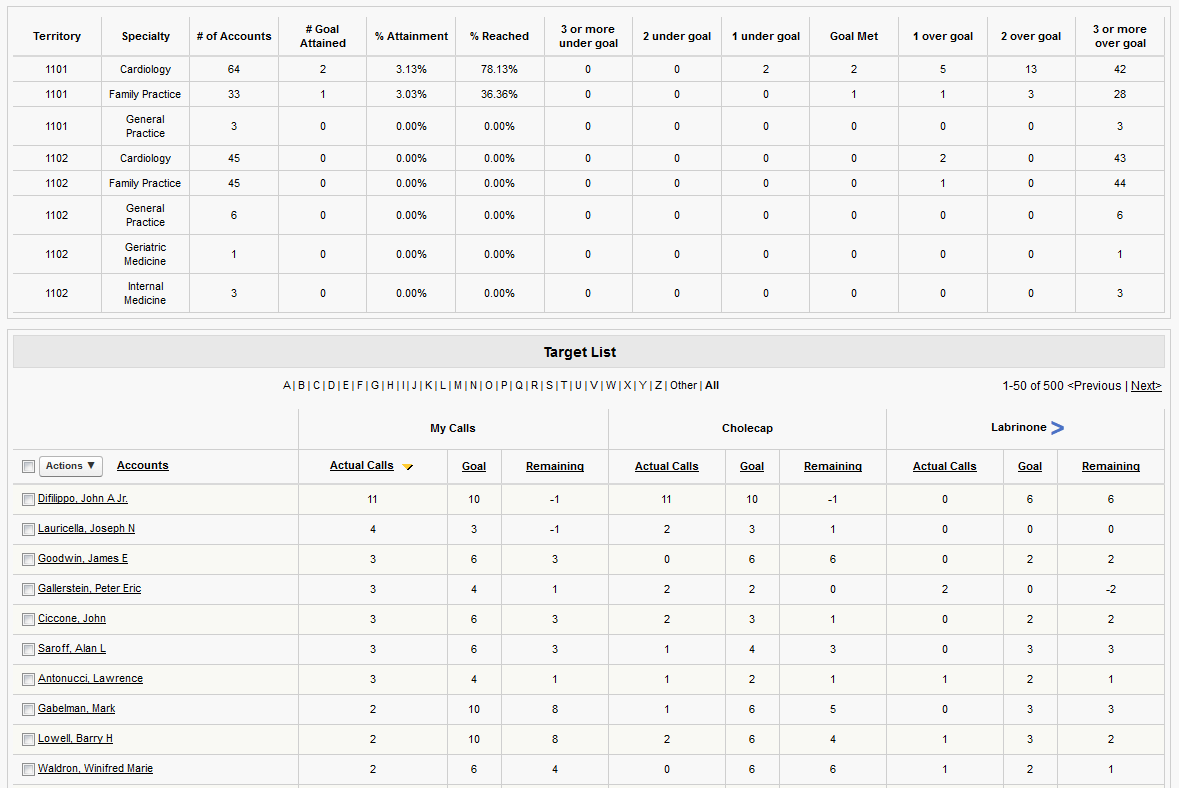
Details on the number of accounts, how many of them has the plan goal been reached, and how many accounts are over or under goal. Must be placed on its own in a row in the Analytics Layout page layout. |
|
Target List |
List of targets in the selected cycle plans, similar to the target list displayed on the Cycle Plan tab. Must be placed on its own in a row in the Analytics Layout page layout. |
The Cycle Plan Analysis report contains the following controls:
|
Control Name |
Description |
|---|---|
|
Start Date & End Date |
Determines which cycle plans are available for selection, based on the start date of the Cycle Plan. |
|
Territories |
Determines which cycle plans are available for selection, based on the territory of the Cycle Plan. |
|
Cycle Plans |
List of cycle plans available for analysis. The list contains any cycle plans the user has visibility to that match the selected territory and have a start date that falls within the time range selected in the Start & End Date controls |
|
Display Products |
The Display Products list lets the user select the products that they would like to see analyzed in the report. The Display Products filter is configurable and can be removed for those customers who do not track Product Detailing within their Cycle Plans. |
|
Display By |
The “Display By” filter on Cycle Plan Analysis is populated with values based on configurable fields that are defined on the Cycle Plan Target Object. These fields pull additional data related to the target from the Account, Address and TSF objects. For more information on how to configure these fields, see the Veeva CRM Administration Guide. If no such fields are configured, the Display By filter will be hidden. |
|
Build Chart Button |
The Build Chart Button will reload the Cycle Plan Analysis Reports based on the currently selected filter criteria. If any of the filter criteria has been changed, a red asterisk will be displayed next to the Build Chart button. |
|
Download to Excel Button |
The Download to Excel button exports the underlying data for each of the Reports to Microsoft Excel. |
|
My/Total Calls |
Radio button control allowing users to choose between calls and details they made (“My Calls”) and calls and details that were made by their team (“Total Calls”). |
The attainment summary, attainment by product, and attainment by cycle plan reports use call attainment percentage calculated as: # actual calls / # planned calls = Call Attainment %, where actual calls counted are only those called on targets that were planned.
The Frequency Details report provides a snapshot of the target accounts in the selected cycle plan(s) and measures how many of the accounts meet, exceed, and do not meet the plan(s) goals:
- # of Accounts: # of accounts with planned calls
- # Goal Attained: # of accounts where # actual calls = # planned called (and # planned calls > 0)
- % Attainment: # of accounts with goal attained ÷ # of accounts with planned calls
- % Reached: # accounts with actual calls ÷ # accounts with planned calls
- 3 or more under goal: # accounts where # planned calls - # actual calls = 3
- 2 under goal: # accounts where the number of planned calls is exactly 2 greater than actual calls
- 1 under goal: # accounts where the number of planned calls is just 1 more than actual calls
- Goal Met: # accounts where actual calls equals planned calls
- 1 over goal: # accounts where the number of actual calls is just 1 more than planned call
- 2 over goal: # accounts where the number of actual calls is exactly 2 greater than planned calls
- 3 or more over goal: # accounts where the number of actual calls is 3 or greater than planned calls
Cycle Plan Analysis Filters and Attainment Reports
Cycle Plan Analysis Frequency Details and Target List Reports