

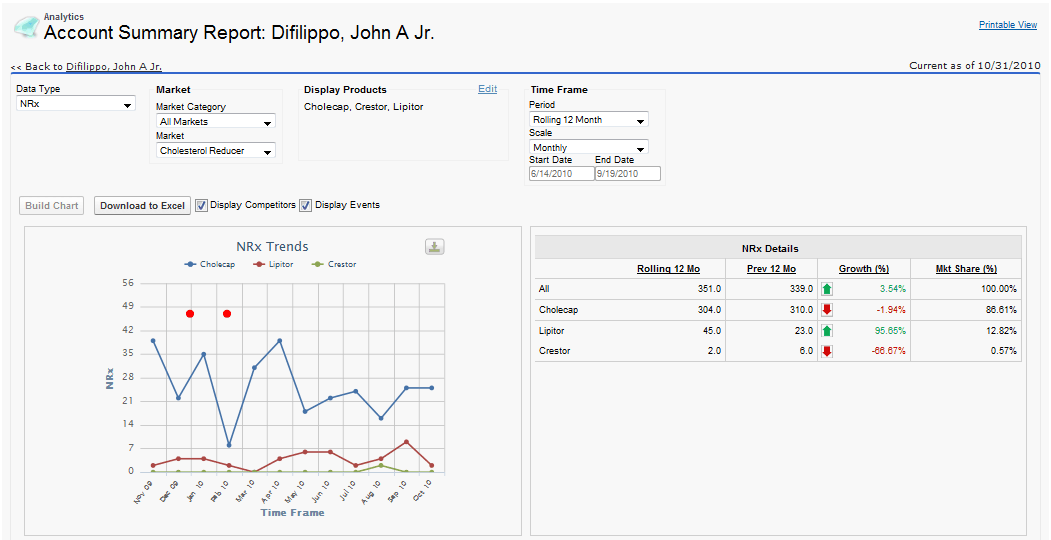
Viewing the Account Summary Report
- Browser
- iPad
The Account Summary report provides sales data trends and analysis specific to a given account in Veeva CRM. Accounts include all types (Professional, Practice, Hospital, etc.) as determined by the sales data files loaded into Fixed Reports.
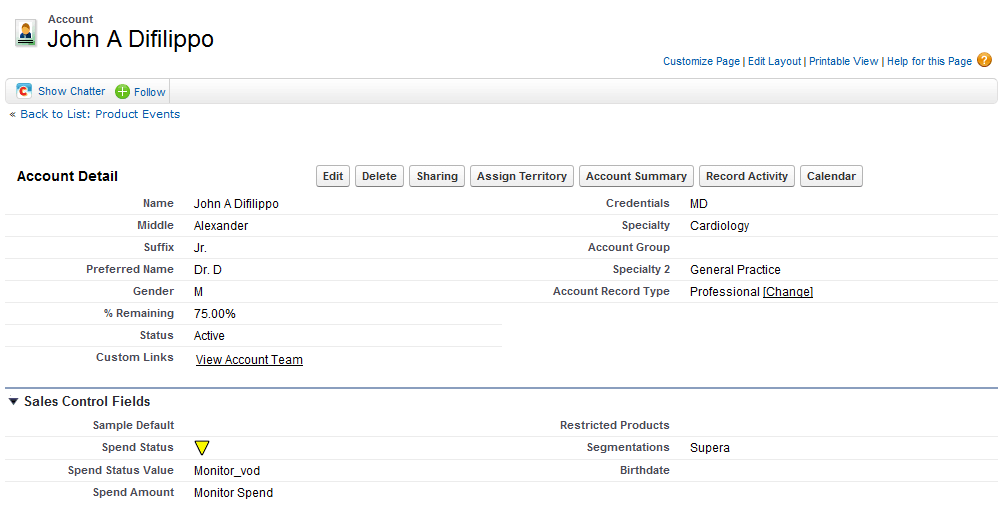
Selecting the Account Summary button on an account detail page displays the summary for that account.
The Account Summary report contains the following reports:
|
Report Name |
Description |
|---|---|
|
Sales Trends |
The Sales Trend Report displays trending of the selected Metric for the selected products over the corresponding time frame. |
|
Sales Details |
Sales Details displays the sum of Sales Data for the currently selected time frame Sales Data by Product. For each product, the sum of the previous time frame is calculated as well as the Growth between the two time periods and the corresponding Market Share for the current time frame. |
|
Top 5 Payers |
The Top 5 Payers report displays the Top 5 Payers for the selected Account based upon the selected criteria. This report is only valid if the Sales Data with Formulary data is loaded into Fixed Reports . The Payer names displayed on the report are driven off the values in the Payer_Plan_vod field in the Sales Data File. |
|
Top 5 Payers by Product |
The Top 5 Payers by Product displays the breakdown of the Top 5 Payers by Product Sales for each of the Top Payers. This report is only valid if the Sales Data with Formulary data is loaded into Fixed Reports . The Payer names displayed on the report are driven off the values in the Payer_Plan_vod field in the Sales Data File. |
|
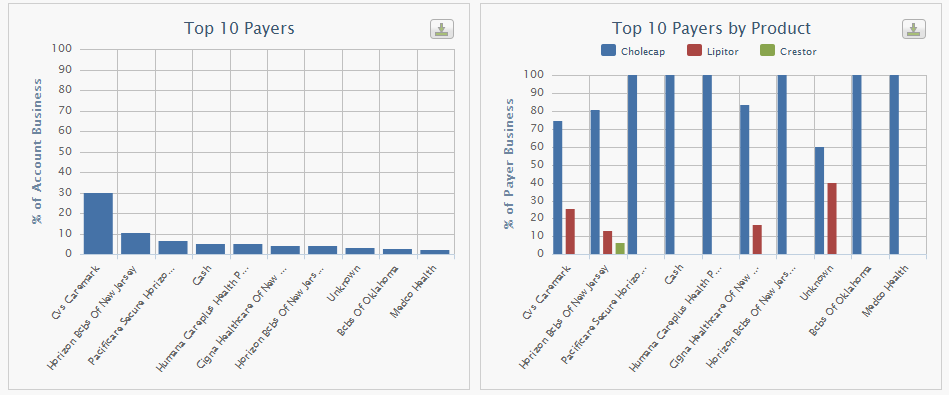
Top 10 Payers |
The Top 10 Payers report displays the Top 10 Payers for the selected Account based upon the selected criteria. This report is only valid if the Sales Data with Formulary data is loaded into Fixed Reports . The Payer names displayed on the report are driven off the values in the Payer_Plan_vod field in the Sales Data File. |
|
Top 10 Payers by Product |
The Top 10 Payers by Product displays the breakdown of the Top 10 Payers by Product Sales for each of the Top Payers. This report is only valid if the Sales Data with Formulary data is loaded into Fixed Reports . The Payer names displayed on the report are driven off the values in the Payer_Plan_vod field in the Sales Data File. |
|
Mkt Share Trends |
The Market Share Trends Report calculates the Market Share over time for each of the Products for the currently selected criteria. |
|
Year Over Year |
The Year Over Year report provides a comparison of a rolling 12 months to the prior 12 months. |
|
Sales by Channel |
Provides a breakdown of the various channels by which a HCP’s prescriptions are being fulfilled. |
|
Goal Details |
Displays a comparison of actual sales to sales goals for this account. Also displays attainment of goals as a percentage of target. |
The Account Summary report contains the following controls:
|
Control Name |
Description |
|---|---|
|
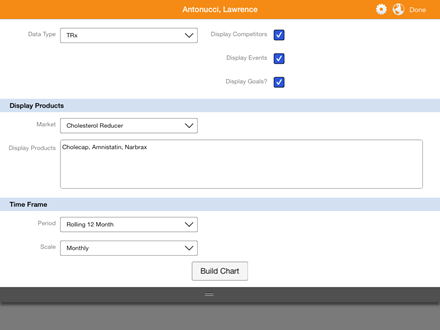
Market Category Picklist |
The Market Category Picklist allows the User to choose whether to see all Markets that the Account has Sales Data for or the Markets that the User is interested in based upon their My Setup products. |
|
Market Picklist |
The Market Picklist is defined based on the Markets available on the Analytics Product Group records. |
|
Display Products Picklist |
The Display Products Picklists allows Products to be selected based upon the currently selected Market |
|
Data Type Picklist |
The Data Type picklist displays all of the different types of Sales Data (i.e. NRx, TRx, Units, etc.) available for the selected Account. If a Territory Adjusted Sales Data data type is selected, the data displayed will be based on the pre-allocated sales data loaded by account and territory. |
|
Period |
The Period controls the display of the time associated to each of the reports. The available values are as follows: Rolling 1 Month, Rolling 3 Month, Rolling 6 Month, Rolling 12 Month, Rolling 24 Month, YTD and Custom. If the Weekly time scale is selected, the Period picklist displays 4 Weeks and 13 Weeks instead of Rolling 1 Month and Rolling 3 Month. Sales data for the selected Time Frame is displayed for each of the report charts. |
|
Start Date & End Date |
If the user selects the Custom option in the Period picklist, the Start Date and End Date are enabled, allowing the user to select a custom time period for all reports on the page. If a user selects anything other than Custom, these controls are disabled and have no effect on the time frame of the report. |
|
Scale |
The Scale controls how the Sales Data will be displayed from a Time Frame perspective. The available values are: Weekly (if applicable), Monthly, and Quarterly. |
|
Territory Selector |
For territory adjusted account level sales data, a new territory selector will be present if the user is aligned to more than one territory. In this case, the user will be initially presented with data allocated to their primary territory, if configured, and will have the option to view data for their secondary territory(ies). District managers will be able to choose which territory to view using the new territory selector. |
|
Display Competitors Checkbox |
The Display Competitors checkbox determines if non-Company Analytics Product Group Records will be displayed on the Reports. The default for this checkbox is checked. |
|
Display Events Checkbox |
The Display Events Checkbox determines if the Product Events are displayed on the Sales Trend and Mkt Share Trends Reports. The default behavior for this checkbox is checked. |
|
Display Goals Checkbox |
When checked and if Sales Goals were pre-loaded, Fixed Reports will display Sales Goals information alongside historical sales. |
|
Build Chart Button |
The Build Chart Button will reload the Account Summary Reports based on the currently selected filter criteria. If any of the filter criteria has been changed, a red asterisk will be displayed next to the Build Chart button. |
|
Download to Excel Button |
The Download to Excel button exports the underlying data for each of the Reports to Microsoft Excel. Only available on the Browser platform. |
Viewing the Account Summary Dashboard on a Mobile Device
If you have large volumes of data to download, do not enable the Account Summary dashboard for users on iPad 2 or earlier. Only iPad 3 and higher are supported.
The Account Summary dashboard provides simple navigation to each of the charts and reports configured online.
Veeva CRM uses a local data cache for improved runtime performance. The cache loads the data the first time a user views the Account Summary dashboard and results in a delay of several seconds when displaying the Account Summary landing screen. Once loaded, displaying reports in the Account Summary dashboard uses the data saved to the local cache.
The local cache is refreshed when the app is restarted either due to a sync process, signing out, or exiting the app.
Select a report tiles to navigate to that chart.
Select the gear icon to navigate to the report filters. After selecting the filter criteria, select the Build Chart button to navigate back to the report.
If you are connected to the internet, tapping the Globe icon navigates to the Account Summary report online.
Selecting Done navigates back to the account detail.
Sales data is synced locally whenever the sync process detects updated sales data on the server. During the Fixed Reports sync, sales data is refreshed in its entirety. There are times when configuration, visibility to accounts, or other meta-data affecting Fixed Reports (for example, My Setup Products or VMOCs for data types downloaded to the device) change. Since the Fixed Reports sync is driven by the presence of new sales data, in these types of scenarios, sales data does not sync down to the device until the next sales data load on the server is done, or if the user performs a full database refresh.
For performance purposes, the Account Summary dashboard for mobile devices is designed with the following differences from the online report:
- Only 12 months of monthly sales data can be downloaded to the device
- The All Markets option is not available. Users are only able to view sales data markets corresponding to their aligned company products.
It is highly recommended to use the Enable_for_Offline_vod feature on the Data_Map_Template_vod object to further limit the volume of data downloaded to mobile devices. See Configuring the Account Summary Report for Mobile Devices for more information.
Loading Analytics Data Channels
As part of the Account Summary report, sales analysis is broken down further by the supply channel (Mail Order, Pharmacy, etc.) of the HCP’s sales. The Analytics_Data_Channel_vod object can be loaded with all channels pertinent to your organization.
After loading the data channels, perform the following to map the channel column in the sales file to the channel column in the Veeva database:
- Create a Data_Map_Template_Field_vod record.
- Select the Data_Channel_vod value for the Vod_Field_vod picklist field.
The name of the data channel is mapped to the Display_Name_vod field on the Analytics_Data_Channel_vod record and used in the report.
Fixed Reports uses a maximum of 10 characters to map to the channel column in the sales file.
